Current hospitalizations for COVID-19 in Arkansas fell below 1,000 this week for the first time since Nov. 25, 2020. On Thursday, Jan. 28, current hospitalizations declined to 996 and further declined on Friday to 951. Deaths reported by the Arkansas Department of Health exceeded 40 every day but one this week, bringing the total to 4,831 deaths among confirmed and probable cases. Since March, there have been 292,563 cases among confirmed and probable cases.
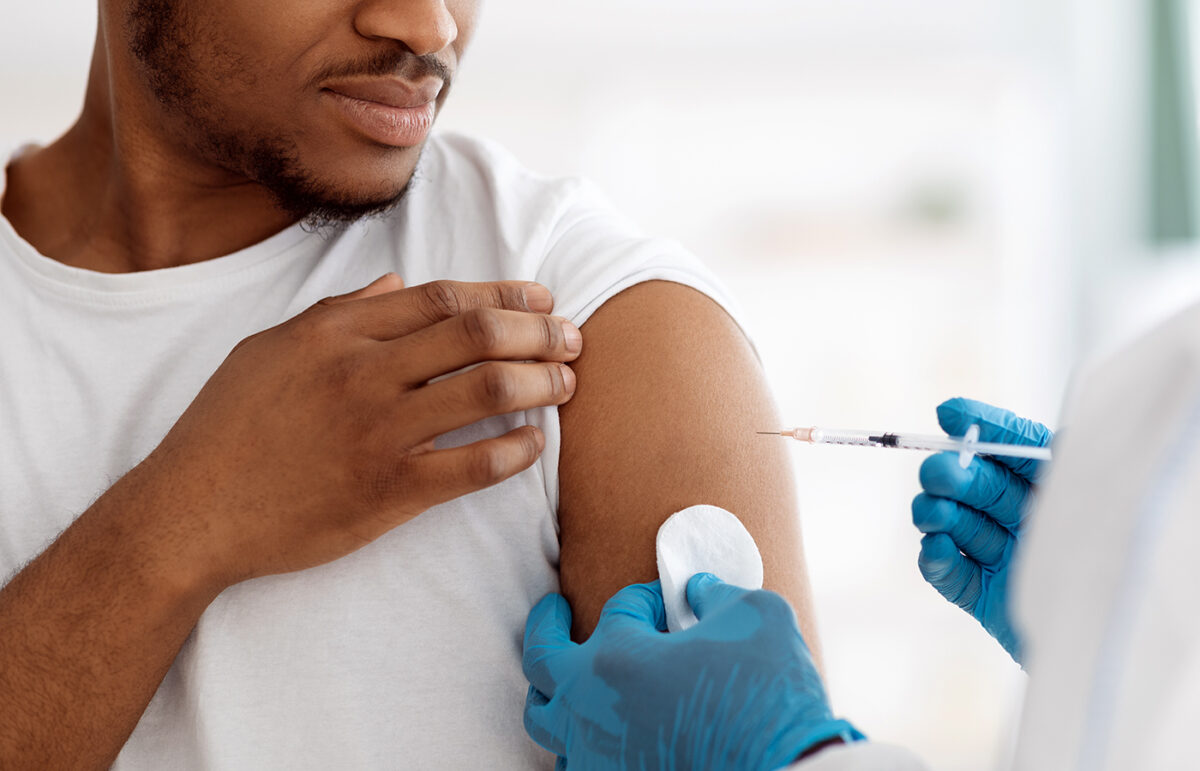
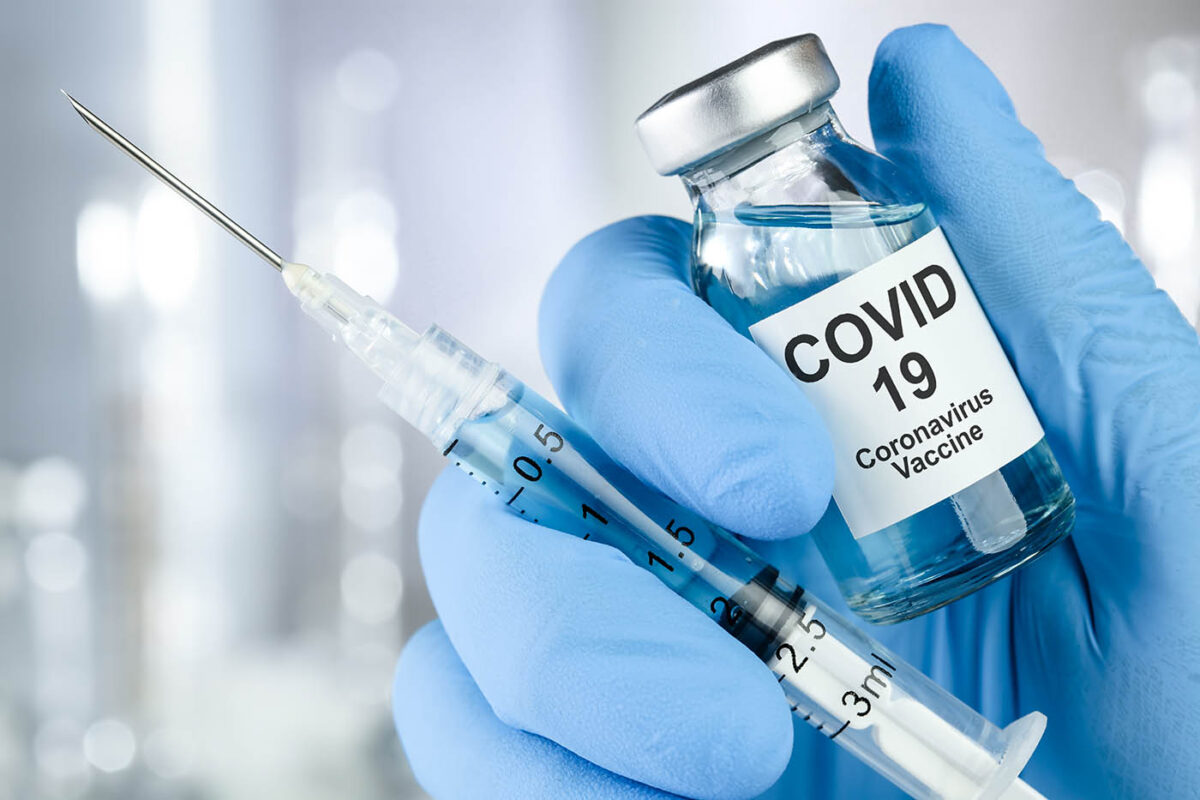
The state continued to make progress in the administration of COVID-19 vaccines this week, as did pharmacy chains CVS and Walgreens, which are charged with administering vaccines at long-term care facilities under the Long-Term Care (LTC) Federal Program. As of Friday, Jan. 29, 519,800 of the 284,928 doses received or allocated had been administered since vaccinations in the state began on Dec. 14.
According to the Arkansas Department of Health’s Educational Institutions Report released Thursday, there are 2,977 active cases among staff members, students, and teachers in the state’s public school districts. Total positive cases increased by 1,411 since the Monday report to 36,976, of which 24,792 are student cases.
At colleges and universities, there are 589 active cases. The three institutions with the most active cases are:
- University of Arkansas in Fayetteville with 116 cases
- Ouachita Baptist University in Arkadelphia with 42 cases
- University of Central Arkansas in Conway with 41 cases
Total positive cases increased by 275 since the Monday report to 12,692 cases. Of these, 9,289 are student cases.
On our COVID-19 in Arkansas page, the COVID-19: Local Data dashboard has been updated with data current through Monday, Jan. 25. We also added a new section that provides a regional look at new known COVID-19 infection rates, active cases in schools, new hospitalizations, and cumulative deaths.
Some key data points:
By School District
There are 128 school districts with high new infection rates — 121 in the red zone and seven in the purple zone. School districts in the red zone have had 50 to 99 new known infections per 10,000 community residents during a 14-day period, as of Jan. 25. School districts in the purple zone have had 100 or more new known infections per 10,000 community residents, or at least 1% of residents, during a 14-day period.
The districts that are in red or purple zones and have at least five new known infections:
- Hazen: 169 new known infections per 10K residents
- Brinkley: 158 new known infections per 10K residents
- Cleveland County: 122 new known infections per 10K residents
- Fordyce: 115 new known infections per 10K residents
- Cedarville: 110 new known infections per 10K residents
- Prairie Grove: 106 new known infections per 10K residents
- Guy-Perkins: 103 new known infections per 10K residents
- Cutter-Morning Star: 99 new known infections per 10K residents
- East Poinsett County: 96 new known infections per 10K residents
- Hampton: 93 new known infections per 10K residents
- Carlisle: 93 new known infections per 10K residents
- South Conway County: 90 new known infections per 10K residents
- Trumann: 89 new known infections per 10K residents
- Ouachita: 86 new known infections per 10K residents
- Farmington: 85 new known infections per 10K residents
- Danville: 84 new known infections per 10K residents
- Dardanelle: 83 new known infections per 10K residents
- Clarendon: 83 new known infections per 10K residents
- Woodlawn: 82 new known infections per 10K residents
- Valley Springs: 82 new known infections per 10K residents
- Vernon-Enola: 82 new known infections per 10K residents
- Augusta: 82 new known infections per 10K residents
- Strong-Huttig: 81 new known infections per 10K residents
- Monticello: 81 new known infections per 10K residents
- Glen Rose: 81 new known infections per 10K residents
- Bradford: 80 new known infections per 10K residents
- Westside: 79 new known infections per 10K residents
- Van Buren: 79 new known infections per 10K residents
- Pottsville: 78 new known infections per 10K residents
- Lonoke: 78 new known infections per 10K residents
- DeWitt: 78 new known infections per 10K residents
- Booneville: 78 new known infections per 10K residents
- Warren: 76 new known infections per 10K residents
- Little Rock: 76 new known infections per 10K residents
- Fort Smith: 76 new known infections per 10K residents
- Waldron: 75 new known infections per 10K residents
- Vilonia: 75 new known infections per 10K residents
- Russellville: 75 new known infections per 10K residents
- Rogers: 75 new known infections per 10K residents
- Greenwood: 75 new known infections per 10K residents
- Alma: 75 new known infections per 10K residents
- Ozark: 74 new known infections per 10K residents
- Lake Hamilton: 74 new known infections per 10K residents
- Bryant: 74 new known infections per 10K residents
- Marked Tree: 73 new known infections per 10K residents
- Bay: 73 new known infections per 10K residents
- Springdale: 72 new known infections per 10K residents
- England: 72 new known infections per 10K residents
- Dover: 72 new known infections per 10K residents
- Prescott: 71 new known infections per 10K residents
- East End: 71 new known infections per 10K residents
- County Line: 71 new known infections per 10K residents
- Conway: 71 new known infections per 10K residents
- Western Yell County: 70 new known infections per 10K residents
- Lavaca: 70 new known infections per 10K residents
- Lakeside: 70 new known infections per 10K residents
- Harmony Grove (Saline County): 70 new known infections per 10K residents
- Camden Fairview: 70 new known infections per 10K residents
- Nemo Vista: 69 new known infections per 10K residents
- Mena: 69 new known infections per 10K residents
- Melbourne: 69 new known infections per 10K residents
- Kirby: 69 new known infections per 10K residents
- Stuttgart: 68 new known infections per 10K residents
- Bergman: 68 new known infections per 10K residents
- Barton-Lexa: 68 new known infections per 10K residents
- Pulaski County Special: 67 new known infections per 10K residents
- North Little Rock: 67 new known infections per 10K residents
- McCrory: 67 new known infections per 10K residents
- Bentonville: 67 new known infections per 10K residents
- Benton: 67 new known infections per 10K residents
- Bauxite: 67 new known infections per 10K residents
- Rector: 66 new known infections per 10K residents
- Hope: 66 new known infections per 10K residents
- Malvern: 65 new known infections per 10K residents
- Lafayette County: 65 new known infections per 10K residents
- Eureka Springs: 65 new known infections per 10K residents
- Atkins: 64 new known infections per 10K residents
- White Hall: 63 new known infections per 10K residents
- Marion: 63 new known infections per 10K residents
- Harrison: 63 new known infections per 10K residents
- Forrest City: 63 new known infections per 10K residents
- Clinton: 63 new known infections per 10K residents
- Paris: 62 new known infections per 10K residents
- Paragould: 62 new known infections per 10K residents
- Lincoln: 62 new known infections per 10K residents
- Greenbrier: 62 new known infections per 10K residents
- Clarksville: 62 new known infections per 10K residents
- Yellville-Summit: 61 new known infections per 10K residents
- Hector: 61 new known infections per 10K residents
- Hamburg: 61 new known infections per 10K residents
- Greene County Tech: 61 new known infections per 10K residents
- Drew Central: 61 new known infections per 10K residents
- Cabot: 61 new known infections per 10K residents
- Blevins: 61 new known infections per 10K residents
- Star City: 60 new known infections per 10K residents
- Smackover: 60 new known infections per 10K residents
- Pine Bluff: 60 new known infections per 10K residents
- Magnet Cove: 60 new known infections per 10K residents
- Jacksonville: 60 new known infections per 10K residents
- Fayetteville: 60 new known infections per 10K residents
- Brookland: 60 new known infections per 10K residents
- McGehee: 59 new known infections per 10K residents
- Gentry: 59 new known infections per 10K residents
- Nettleton: 58 new known infections per 10K residents
- Arkadelphia: 58 new known infections per 10K residents
- Magazine: 57 new known infections per 10K residents
- Watson Chapel: 56 new known infections per 10K residents
- Rivercrest: 56 new known infections per 10K residents
- Perryville: 56 new known infections per 10K residents
- Mulberry-Pleasant View: 56 new known infections per 10K residents
- Hot Springs: 56 new known infections per 10K residents
- Mayflower: 55 new known infections per 10K residents
- Hackett: 55 new known infections per 10K residents
- South Side: 54 new known infections per 10K residents
- Scranton: 54 new known infections per 10K residents
- Ozark Mountain: 54 new known infections per 10K residents
- Elkins: 54 new known infections per 10K residents
- Norfork: 53 new known infections per 10K residents
- Wynne: 52 new known infections per 10K residents
- Siloam Springs: 52 new known infections per 10K residents
- Pea Ridge: 52 new known infections per 10K residents
- Mountainburg: 52 new known infections per 10K residents
- Jonesboro: 52 new known infections per 10K residents
- Charleston: 52 new known infections per 10K residents
- Gurdon: 51 new known infections per 10K residents
- Corning: 51 new known infections per 10K residents
- Alpena: 51 new known infections per 10K residents
- Two Rivers: 50 new known infections per 10K residents
By Community
The communities that have the highest new known infection rates per 10,000 residents and have at least 10 new known infections:
- Hazen: 212 new known infections per 10K residents
- Kingsland: 204 new known infections per 10K residents
- De Valls Bluff: 162 new known infections per 10K residents
- Brinkley: 160 new known infections per 10K residents
- Cleveland: 158 new known infections per 10K residents
- Perry: 155 new known infections per 10K residents
- Enola: 142 new known infections per 10K residents
- Cave Springs: 138 new known infections per 10K residents
- Poplar Grove: 136 new known infections per 10K residents
- Hampton: 123 new known infections per 10K residents
By ZIP Code
The ZIP codes that have the highest rates of new known infections and have at least 10 new known infections:
- 71998: 625 new known infections per 10K residents
- 72064: 212 new known infections per 10K residents
- 71652: 204 new known infections per 10K residents
- 72041: 162 new known infections per 10K residents
- 72021: 160 new known infections per 10K residents


