


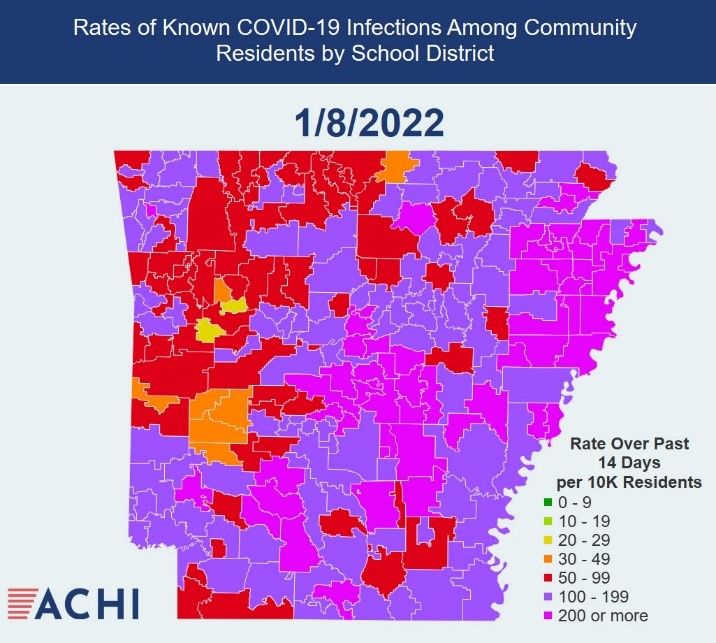
LITTLE ROCK ― A record 226 Arkansas public school districts, or 97% of the state’s 234 contiguous school districts, have COVID-19 infection rates of 50 or more new known infections per 10,000 district residents over a 14-day period, the Arkansas Center for Health Improvement said Monday, citing its analysis of Arkansas Department of Health data current as of Saturday.
ACHI made a special update to the COVID-19 dashboard on its website Monday in response to the accelerated spread of the virus. ACHI also added a new color, pink, to the maps on the dashboard, available at achi.net/covid19, to signify an infection rate of 200 or more new known infections per 10,000 district residents over the past 14 days, or at least 2% of the district’s population. In some districts, more than 4% of residents in the local community are known to be infected.
In the face of the immediate threat posed by the explosion of the omicron variant across Arkansas communities, ACHI calls for the following short-term actions:
- implementation of masking requirements for all staff and students in all schools across the state;
- virtual instruction for schools in the purple and pink zones;
- sheltering in place for seniors, families with unvaccinated children, and families with members who are immunocompromised or at risk because of health conditions such as heart disease, lung disease, diabetes or cancer; and
- suspension of public interactions or implementation of virtual options where possible on the part of municipalities, businesses and houses of worship.
“Because of the highly infectious omicron variant, COVID-19 is raging uncontrolled across our state,” said ACHI President and CEO Dr. Joe Thompson. “Unfortunately, we need to endure some temporary disruptions in our daily lives so we can stop the virus’ spread.”
The previous record for school districts with 14-day COVID-19 infection rates of 50 or more new known infections per 10,000 district residents was 201, which was reached last January and again in August.
Of the 226 districts with 14-day infection rates of 50 or more new known infections per 10,000 residents, 61 districts have 50 to 99 new known infections per 10,000 residents (red on ACHI’s map); 110 districts have 100 to 199 new known infections per 10,000 residents (purple); and 55 districts have 200 or more new known infections per 10,000 residents (pink).
The 55 districts in pink on ACHI’s map are:
o Nettleton – over 4.9% of local community infected
o Brookland – over 4.2% of local community infected
o Jonesboro – over 4.1% of local community infected
o Trumann – over 3.9% of local community infected
o Little Rock – over 3.8% of local community infected
o Valley View – over 3.7% of local community infected
o Osceola – over 3.5% of local community infected
o Marion – over 3.5% of local community infected
o West Memphis – over 3.1% of local community infected
o Riverside – over 3.1% of local community infected
o Marked Tree – over 3.1% of local community infected
o North Little Rock – over 3.1% of local community infected
o Earle – over 3.1% of local community infected
o Manila – over 3% of local community infected
o Gurdon – over 3% of local community infected
o Paragould – over 3% of local community infected
o Guy-Perkins – over 2.9% of local community infected
o Bay – over 2.9% of local community infected
o Pulaski County Special – over 2.9% of local community infected
o Westside Consolidated – over 2.9% of local community infected
o Barton-Lexa – over 2.8% of local community infected
o Blytheville – over 2.8% of local community infected
o Conway – over 2.8% of local community infected
o White Hall – over 2.7% of local community infected
o Bryant – over 2.7% of local community infected
o Bauxite – over 2.7% of local community infected
o Stuttgart – over 2.7% of local community infected
o Marmaduke – over 2.6% of local community infected
o Greenbrier – over 2.6% of local community infected
o Harrisburg – over 2.6% of local community infected
o Jacksonville – over 2.6% of local community infected
o Buffalo Island Central – over 2.5% of local community infected
o El Dorado – over 2.5% of local community infected
o Forrest City – over 2.5% of local community infected
o Clarendon – over 2.4% of local community infected
o England – over 2.4% of local community infected
o Benton – over 2.4% of local community infected
o East Poinsett County – over 2.4% of local community infected
o Farmington – over 2.3% of local community infected
o Vilonia – over 2.3% of local community infected
o Nashville – over 2.3% of local community infected
o Lonoke – over 2.3% of local community infected
o Palestine/Wheatley – over 2.3% of local community infected
o Prescott – over 2.2% of local community infected
o Helena/West Helena – over 2.2% of local community infected
o Carlisle – over 2.1% of local community infected
o Star City – over 2.1% of local community infected
o Cabot – over 2.1% of local community infected
o Camden Fairview – over 2.1% of local community infected
o Arkadelphia – over 2.1% of local community infected
o Cleveland County – over 2% of local community infected
o Melbourne – over 2% of local community infected
o Pine Bluff – over 2% of local community infected
o Rivercrest – over 2% of local community infected
o Wynne – over 2% of local community infected
As of Saturday, the following 226 school districts had infection rates of at least 50 new known infections per 10,000 district residents over the previous 14 days. An asterisk indicates that a district is new to the list this week.
o Alma*
o Alpena*
o Arkadelphia – rate of 200 or more new known infections per 10K residents
o Armorel – rate of 100 or more new known infections per 10K residents
o Ashdown – rate of 100 or more new known infections per 10K residents
o Atkins – rate of 100 or more new known infections per 10K residents
o Augusta* – rate of 100 or more new known infections per 10K residents
o Bald Knob – rate of 100 or more new known infections per 10K residents
o Barton-Lexa – rate of 200 or more new known infections per 10K residents
o Batesville* – rate of 100 or more new known infections per 10K residents
o Bauxite – rate of 200 or more new known infections per 10K residents
o Bay – rate of 200 or more new known infections per 10K residents
o Bearden*
o Beebe – rate of 100 or more new known infections per 10K residents
o Benton – rate of 200 or more new known infections per 10K residents
o Bentonville – rate of 100 or more new known infections per 10K residents
o Bergman*
o Berryville*
o Bismarck*
o Blevins*
o Blytheville – rate of 200 or more new known infections per 10K residents
o Booneville*
o Bradford – rate of 100 or more new known infections per 10K residents
o Brinkley – rate of 100 or more new known infections per 10K residents
o Brookland – rate of 200 or more new known infections per 10K residents
o Bryant – rate of 200 or more new known infections per 10K residents
o Buffalo Island Central – rate of 200 or more new known infections per 10K residents
o Cabot – rate of 200 or more new known infections per 10K residents
o Calico Rock – rate of 100 or more new known infections per 10K residents
o Camden Fairview – rate of 200 or more new known infections per 10K residents
o Carlisle – rate of 200 or more new known infections per 10K residents
o Cave City*
o Cedar Ridge – rate of 100 or more new known infections per 10K residents
o Cedarville*
o Centerpoint*
o Charleston* – rate of 100 or more new known infections per 10K residents
o Clarendon – rate of 200 or more new known infections per 10K residents
o Clarksville*
o Cleveland County – rate of 200 or more new known infections per 10K residents
o Clinton – rate of 100 or more new known infections per 10K residents
o Concord* – rate of 100 or more new known infections per 10K residents
o Conway – rate of 200 or more new known infections per 10K residents
o Corning – rate of 100 or more new known infections per 10K residents
o Cossatot River* – rate of 100 or more new known infections per 10K residents
o Cotter*
o County Line*
o Cross County* – rate of 100 or more new known infections per 10K residents
o Crossett* – rate of 100 or more new known infections per 10K residents
o Cutter-Morning Star* – rate of 100 or more new known infections per 10K residents
o Danville* – rate of 100 or more new known infections per 10K residents
o Dardanelle – rate of 100 or more new known infections per 10K residents
o Decatur – rate of 100 or more new known infections per 10K residents
o Deer-Mt. Judea* – rate of 100 or more new known infections per 10K residents
o DeQueen* – rate of 100 or more new known infections per 10K residents
o Dermott* – rate of 100 or more new known infections per 10K residents
o Des Arc*
o DeWitt – rate of 100 or more new known infections per 10K residents
o Dierks* – rate of 100 or more new known infections per 10K residents
o Dover*
o Drew Central*
o Dumas – rate of 100 or more new known infections per 10K residents
o Earle – rate of 200 or more new known infections per 10K residents
o East End – rate of 100 or more new known infections per 10K residents
o East Poinsett County – rate of 200 or more new known infections per 10K residents
o El Dorado – rate of 200 or more new known infections per 10K residents
o Elkins – rate of 100 or more new known infections per 10K residents
o Emerson-Taylor-Bradley*
o England – rate of 200 or more new known infections per 10K residents
o Eureka Springs – rate of 100 or more new known infections per 10K residents
o Farmington – rate of 200 or more new known infections per 10K residents
o Fayetteville – rate of 100 or more new known infections per 10K residents
o Flippin*
o Fordyce* – rate of 100 or more new known infections per 10K residents
o Foreman* – rate of 100 or more new known infections per 10K residents
o Forrest City – rate of 200 or more new known infections per 10K residents
o Fort Smith* – rate of 100 or more new known infections per 10K residents
o Fouke*
o Fountain Lake
o Genoa Central*
o Gentry
o Glen Rose – rate of 100 or more new known infections per 10K residents
o Gosnell – rate of 100 or more new known infections per 10K residents
o Gravette*
o Green Forest*
o Greenbrier – rate of 200 or more new known infections per 10K residents
o Greene County Tech – rate of 100 or more new known infections per 10K residents
o Greenland*
o Greenwood – rate of 100 or more new known infections per 10K residents
o Gurdon – rate of 200 or more new known infections per 10K residents
o Guy-Perkins – rate of 200 or more new known infections per 10K residents
o Hackett*
o Hamburg – rate of 100 or more new known infections per 10K residents
o Hampton* – rate of 100 or more new known infections per 10K residents
o Harmony Grove (Clark, Dallas, and Ouachita Counties) – rate of 100 or more new known infections per 10K residents
o Harmony Grove (Saline County) – rate of 100 or more new known infections per 10K residents
o Harrisburg – rate of 200 or more new known infections per 10K residents
o Harrison* – rate of 100 or more new known infections per 10K residents
o Hazen – rate of 100 or more new known infections per 10K residents
o Heber Springs – rate of 100 or more new known infections per 10K residents
o Hector
o Helena-West Helena – rate of 200 or more new known infections per 10K residents
o Hermitage*
o Highland – rate of 100 or more new known infections per 10K residents
o Hillcrest
o Hope – rate of 100 or more new known infections per 10K residents
o Horatio – rate of 100 or more new known infections per 10K residents
o Hot Springs* – rate of 100 or more new known infections per 10K residents
o Hoxie – rate of 100 or more new known infections per 10K residents
o Huntsville*
o Izard County Consolidated – rate of 100 or more new known infections per 10K residents
o Jackson County – rate of 100 or more new known infections per 10K residents
o Jacksonville – rate of 200 or more new known infections per 10K residents
o Jasper
o Jessieville*
o Jonesboro – rate of 200 or more new known infections per 10K residents
o Junction City – rate of 100 or more new known infections per 10K residents
o Lafayette County* – rate of 100 or more new known infections per 10K residents
o Lake Hamilton* – rate of 100 or more new known infections per 10K residents
o Lakeside (Ashley and Chicot Counties) – rate of 100 or more new known infections per 10K residents
o Lakeside* – rate of 100 or more new known infections per 10K residents
o Lamar*
o Lavaca*
o Lawrence County – rate of 100 or more new known infections per 10K residents
o Lead Hill*
o Lee County – rate of 100 or more new known infections per 10K residents
o Lincoln* – rate of 100 or more new known infections per 10K residents
o Little Rock – rate of 200 or more new known infections per 10K residents
o Lonoke – rate of 200 or more new known infections per 10K residents
o Magnet Cove – rate of 100 or more new known infections per 10K residents
o Magnolia – rate of 100 or more new known infections per 10K residents
o Malvern – rate of 100 or more new known infections per 10K residents
o Mammoth Spring – rate of 100 or more new known infections per 10K residents
o Manila – rate of 200 or more new known infections per 10K residents
o Mansfield*
o Marion – rate of 200 or more new known infections per 10K residents
o Marked Tree – rate of 200 or more new known infections per 10K residents
o Marmaduke – rate of 200 or more new known infections per 10K residents
o Marvell – rate of 100 or more new known infections per 10K residents
o Mayflower – rate of 100 or more new known infections per 10K residents
o Maynard
o McCrory*
o McGehee* – rate of 100 or more new known infections per 10K residents
o Melbourne – rate of 200 or more new known infections per 10K residents
o Mena*
o Midland*
o Mineral Springs – rate of 100 or more new known infections per 10K residents
o Monticello – rate of 100 or more new known infections per 10K residents
o Mountain Home
o Mountain Pine*
o Mountain View*
o Mountainburg*
o Mt. Vernon-Enola – rate of 100 or more new known infections per 10K residents
o Mulberry-Pleasant View*
o Nashville – rate of 200 or more new known infections per 10K residents
o Nemo Vista*
o Nettleton – rate of 200 or more new known infections per 10K residents
o Nevada – rate of 100 or more new known infections per 10K residents
o Newport – rate of 100 or more new known infections per 10K residents
o Norfork*
o North Little Rock – rate of 200 or more new known infections per 10K residents
o Omaha
o Osceola – rate of 200 or more new known infections per 10K residents
o Ouachita – rate of 100 or more new known infections per 10K residents
o Ozark Mountain*
o Ozark*
o Palestine-Wheatley – rate of 200 or more new known infections per 10K residents
o Pangburn* – rate of 100 or more new known infections per 10K residents
o Paragould – rate of 200 or more new known infections per 10K residents
o Paris*
o Parkers Chapel – rate of 100 or more new known infections per 10K residents
o Pea Ridge – rate of 100 or more new known infections per 10K residents
o Perryville – rate of 100 or more new known infections per 10K residents
o Piggott* – rate of 100 or more new known infections per 10K residents
o Pine Bluff – rate of 200 or more new known infections per 10K residents
o Pocahontas – rate of 100 or more new known infections per 10K residents
o Pottsville* – rate of 100 or more new known infections per 10K residents
o Poyen – rate of 100 or more new known infections per 10K residents
o Prairie Grove – rate of 100 or more new known infections per 10K residents
o Prescott – rate of 200 or more new known infections per 10K residents
o Pulaski County Special – rate of 200 or more new known infections per 10K residents
o Quitman* – rate of 100 or more new known infections per 10K residents
o Rector*
o Rivercrest – rate of 200 or more new known infections per 10K residents
o Riverside – rate of 200 or more new known infections per 10K residents
o Riverview – rate of 100 or more new known infections per 10K residents
o Rogers – rate of 100 or more new known infections per 10K residents
o Rose Bud – rate of 100 or more new known infections per 10K residents
o Russellville – rate of 100 or more new known infections per 10K residents
o Salem* – rate of 100 or more new known infections per 10K residents
o Searcy – rate of 100 or more new known infections per 10K residents
o Searcy County – rate of 100 or more new known infections per 10K residents
o Sheridan – rate of 100 or more new known infections per 10K residents
o Shirley*
o Siloam Springs* – rate of 100 or more new known infections per 10K residents
o Sloan-Hendrix* – rate of 100 or more new known infections per 10K residents
o Smackover – rate of 100 or more new known infections per 10K residents
o South Conway County – rate of 100 or more new known infections per 10K residents
o South Pike County – rate of 100 or more new known infections per 10K residents
o South Side – rate of 100 or more new known infections per 10K residents
o Southside – rate of 100 or more new known infections per 10K residents
o Spring Hill
o Springdale – rate of 100 or more new known infections per 10K residents
o Star City – rate of 200 or more new known infections per 10K residents
o Strong-Huttig – rate of 100 or more new known infections per 10K residents
o Stuttgart – rate of 200 or more new known infections per 10K residents
o Texarkana* – rate of 100 or more new known infections per 10K residents
o Trumann – rate of 200 or more new known infections per 10K residents
o Two Rivers*
o Valley Springs* – rate of 100 or more new known infections per 10K residents
o Valley View – rate of 200 or more new known infections per 10K residents
o Van Buren – rate of 100 or more new known infections per 10K residents
o Vilonia – rate of 200 or more new known infections per 10K residents
o Waldron*
o Warren* – rate of 100 or more new known infections per 10K residents
o Watson Chapel – rate of 100 or more new known infections per 10K residents
o West Fork – rate of 100 or more new known infections per 10K residents
o West Memphis – rate of 200 or more new known infections per 10K residents
o West Side
o Western Yell County
o Westside Consolidated – rate of 200 or more new known infections per 10K residents
o White County Central* – rate of 100 or more new known infections per 10K residents
o White Hall – rate of 200 or more new known infections per 10K residents
o Wonderview – rate of 100 or more new known infections per 10K residents
o Woodlawn*
o Wynne – rate of 200 or more new known infections per 10K residents
o Yellville-Summit*
The infection rates reported by ACHI are based on infections among community residents living within the geographical boundaries of each school district and not only on cases among school employees and students.
Known infections include confirmed and probable cases. Probable cases are based on verbal reporting and antigen test results, as identified by the Department of Health. Reported rates do not include results from at-home testing, thus the true level of infections is likely higher than that reported.
Infection rates and counts are not reported for districts with fewer than five reported infections to reduce the possibility of identifying individuals. School district counts do not include infections among incarcerated populations, in nursing homes, or in human development centers.
ACHI also updated the maps and tables on its website displaying vaccination rates by public school district, community, and ZIP code, using Department of Health data current as of Saturday. Twenty-three school districts have achieved vaccination rates of at least 50% of district residents, one of them over 60%: Bentonville, at 61%.
ACHI is a nonpartisan, independent health policy center that serves as a catalyst for improving the health of all Arkansans through evidence-based research, public issue advocacy, and collaborative program development.
###