Blog

2025 County Health Rankings & Roadmaps Report Shows Continuing Health Disparities Across Arkansas

March 19, 2025

Author

Elizabeth (Izzy) Montgomery, MPA
Policy Analyst

Contact

ACHI Communications
501-526-2244
jlyon@achi.net

  • Subscribe for Updates

The 2025 County Health Rankings & Roadmaps report reveals significant differences in health across Arkansas counties. While some counties stand out as among the healthiest in the nation, others continue to face steep barriers shaped by economic and social conditions.

The annual report, released Wednesday, March 19, differs from past installments in several ways. Notably, the 2025 report no longer assigns counties individual ranks for comparison. Instead, counties are now grouped based on similar health conditions, making it easier to compare counties in Arkansas to counties in other states facing similar challenges.

Another change is the introduction of a new model for understanding what shapes health and well-being, emphasizing the role of power and societal rules. The new model includes measures divided into four groups:

  • Population Health and Well-Being. These measures represent how well and how long people live, encompassing physical, mental, and social health. The report continues to highlight persistent gaps in health outcomes, demonstrating that not all communities have the same opportunities to thrive.
  • Community Conditions. These measures reflect how factors such as affordable housing, access to nutritious food, and economic stability shape daily life and influence long-term health.
  • Societal Rules. This component of the model reflects both the written and unwritten rules that determine how resources and opportunities are distributed. Written rules include those formalized in policies and laws, while worldviews and norms reflect unwritten rules.
  • Power. These measures relate to the ability to influence decisions that shape health outcomes. The report emphasizes that when power is concentrated in the hands of a few, it can perpetuate disparities. However, communities that organize and advocate for policy changes can shift the balance, ensuring that health-promoting resources are more evenly distributed.

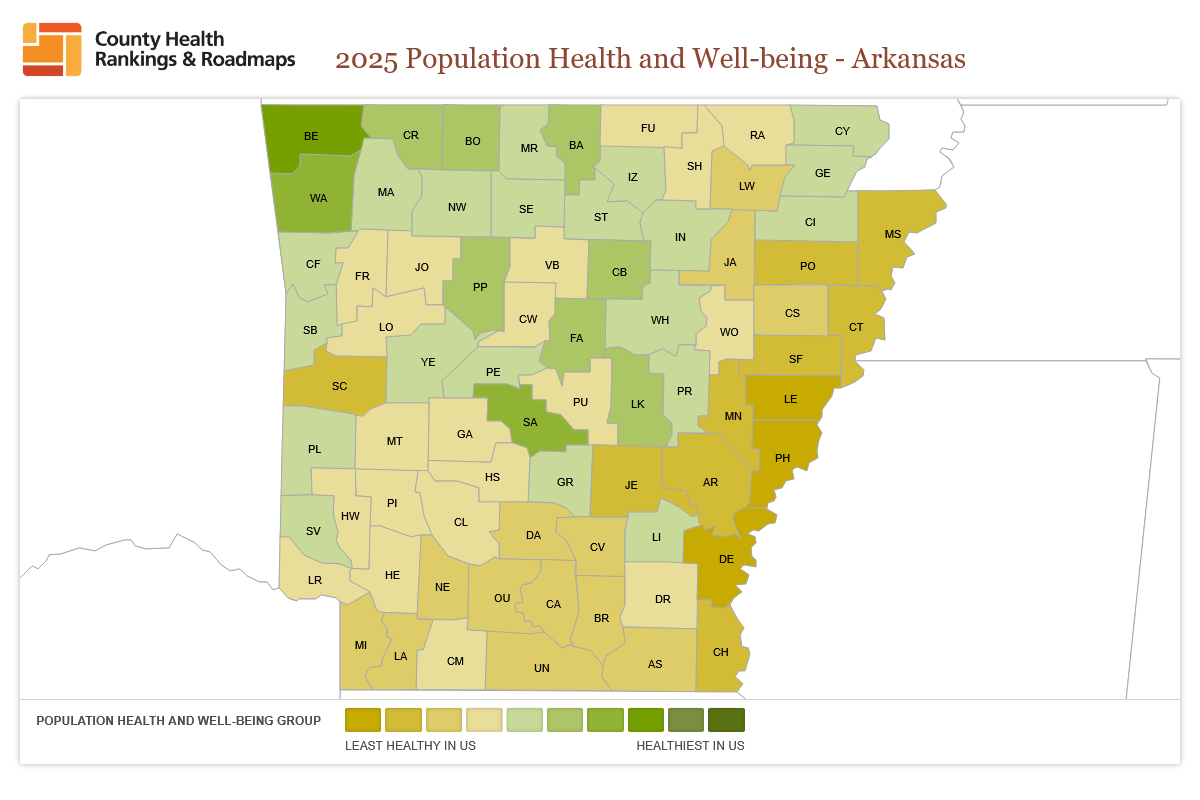
In the Population Health and Well-Being group, each county is assigned a health status ranging from least healthy in the U.S. to healthiest in the U.S. Benton County is among the healthiest counties in the U.S., with Saline and Washington counties also among the healthier counties in the U.S., as shown in the first map below. Arkansas counties that are among the least healthy in the U.S. are Desha, Lee, and Phillips, all located in the Delta. Generally, counties across the Delta region and the southern half of the state have health statuses near the lower end of the scale.

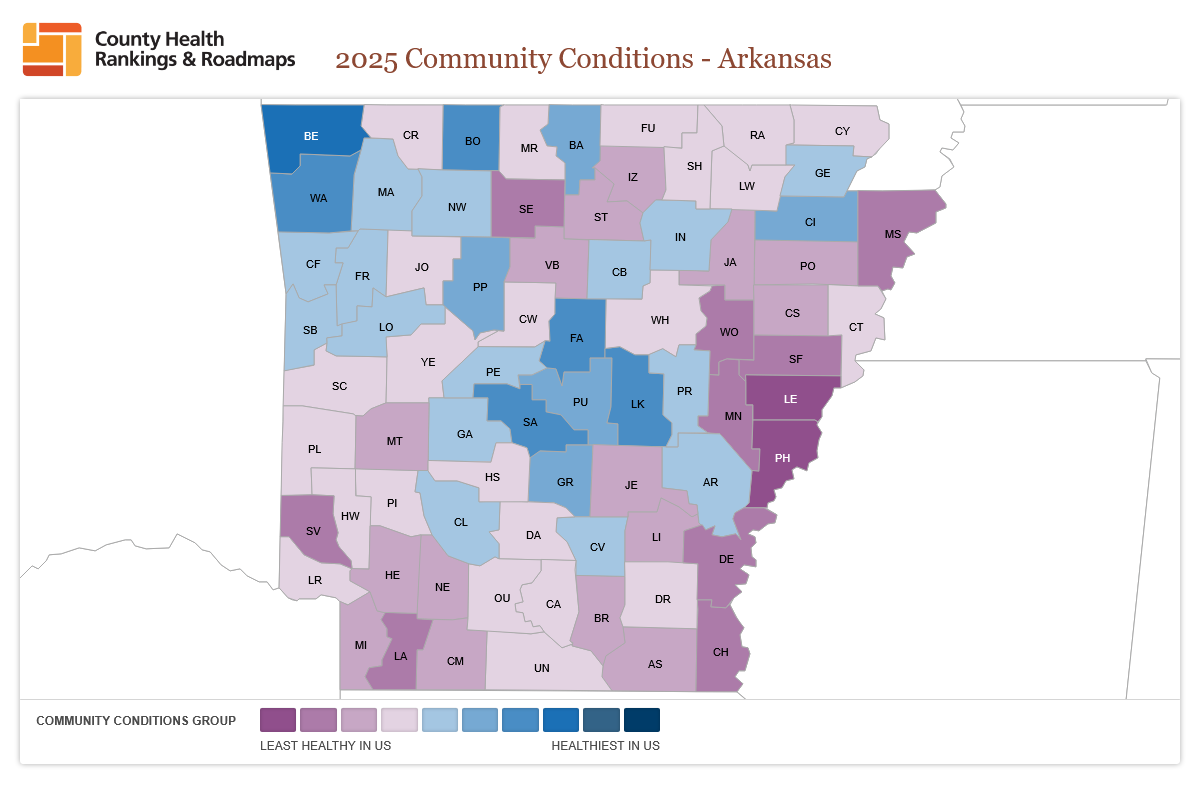
In the Community Conditions group, Benton County again is among the healthiest counties in the U.S., as shown in the map below. Boone, Faulkner, Lonoke, Saline, and Washington counties are also among the healthier counties in the U.S., while Lee and Phillips counties are among the least healthy in the U.S.

County Health Rankings & Roadmaps, a program of the University of Wisconsin Population Health Institute, also provides comparisons between Arkansas and the U.S. average for each measure.

For the Population Health and Well-Being group, the first table below shows how Arkansas compares nationally on certain summary measures and identifies the best- and worst-performing Arkansas counties for those measures.

    Population Health and Well-Being MeasuresArkansas MeasurementU.S. MeasurementBest-Performing Arkansas CountiesWorst-Performing Arkansas Counties
    Premature Death11,400 years of life lost to deaths of people under age 75, per 100,000 people8,400 years of life lost to deaths of people under age 75, per 100,000 people• Benton: 6,900 years of potential life lost before age 75 per 100,000 people
    • Washington: 8,100 years of potential life lost before age 75 per 100,000 people
    • Faulkner: 9,000 years of potential life lost before age 75 per 100,000 people
    • Phillips: 20,000 years of potential life lost before age 75 per 100,000 people
    • Monroe: 18,700 years of potential life lost before age 75 per 100,000 people
    • Scott: 18,500 years of potential life lost before age 75 per 100,000 people
    Poor Physical Health DaysAverage number of physically unhealthy days reported in the past 30 days: 5.2Average number of physically unhealthy days reported in the past 30 days: 3.9• Saline: 4.4 days
    • Benton: 4.5 days
    • Pulaski: 4.7 days
    • Desha, Phillips: 6.1 days
    • Johnson, St. Francis: 6 days
    • Poinsett, Stone, Ashley, Lafayette: 5.9 days
    Poor Mental Health DaysAverage number of mentally unhealthy days reported in the past 30 days: 6.4Average number of mentally unhealthy days reported in the past 30 days: 5.1• Benton: 5.6 days
    • Lonoke, Saline: 5.8 days
    • Washington: 5.9 days
    • Poinsett: 7 days
    • Desha, Van Buren, Lawrence, Cleveland, Searcy: 6.9 days
    • Phillips, Fulton: 6.8 days

    For the Community Conditions group, the table below shows how Arkansas compares to the nation on certain summary measures and identifies the best- and worst-performing Arkansas counties for those measures.

    Community Conditions MeasuresArkansas MeasurementU.S. MeasurementBest-Performing Arkansas CountiesWorst-Performing Arkansas Counties
    Flu Vaccinations46% of fee-for-service Medicare enrollees who had annual flu vaccination48% of fee-for-service Medicare enrollees who had annual flu vaccination• Garland: 54%
    • Benton, Craighead, Pulaski, Saline: 52%
    • Jackson, Sebastian, Washington: 51%
    • Searcy: 20%
    • Lawrence, Monroe: 26%
    • Polk: 27%
    Mammography
    Screening
    41% of female Medicare enrollees ages 65-74 who received annual mammography screening44% of female Medicare enrollees ages 65-74 who received annual mammography screening• Baxter: 48%
    • Craighead, Crawford, Sebastian: 47%
    • Randolph: 46%
    • Montgomery: 28%
    • Phillips: 29%
    • Polk, Yell: 30%
    Severe Housing Problems13% of households with at least 1 of 4 housing problems: overcrowding, high housing costs, lack of kitchen facilities, or lack of plumbing facilities17% of households with at least 1 of 4 housing problems: overcrowding, high housing costs, lack of kitchen facilities, or lack of plumbing facilities• Cleveland: 5%
    • Calhoun, Prairie: 6%
    • Lincoln, Little River: 7%
    • Lee: 19%
    • Phillips, St. Francis: 17%
    • Pulaski, Union, Crittenden, Faulkner, Stone, Washington: 16%

    Summary report measures that are more favorable for Arkansas than the U.S. as a whole include:

    • Unemployment, defined as the percentage of the population age 16 and older who are unemployed and seeking work (3.3% in Arkansas vs. 3.6% nationally).
    • Income inequality, defined as the ratio of household incomes at the 80th percentile (or higher than 80% of household incomes) to household incomes at the 20th percentile (4.8 in Arkansas vs. 4.9 nationally).
    • Social associations, defined as the number of memberships in groups and organizations per 10,000 people (11.7 in Arkansas vs. 9.1 nationally).

    The 2025 report underscores the deep-rooted disparities that continue to shape health outcomes across Arkansas. While some counties are thriving, many face persistent barriers driven by social and economic factors. Addressing these challenges requires collaboration across sectors to create conditions in which all Arkansans have the opportunity to live longer, healthier lives. The County Health Rankings & Roadmaps website includes a section on strategies and solutions, including the What Works for Health tool, which helps communities identify evidence-based policies and programs tailored to their needs.

    For more, see our posts on the 2022, 2023, and 2024 County Health Rankings & Roadmaps reports.

      Skip to content