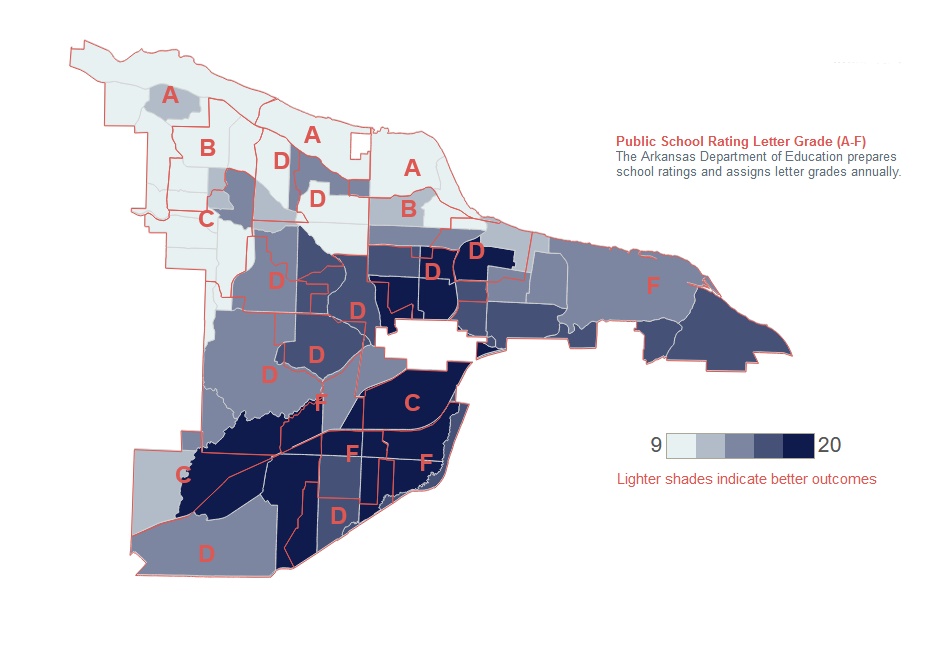
These maps utilize City Health Dashboard data mapped at the elementary school zone level within the Fayetteville, Fort Smith, Little Rock, and Springdale school districts. We have mapped Jonesboro at the school district level to account for the Jonesboro School District’s unique elementary magnet school system. Students may choose which magnet school to attend, so ZIP code risk may not reflect school outcomes.
The tool allows the user to select and view each of the following metrics:
• Children in poverty
• Adults in frequent mental distress
• Adults in frequent physical distress
• COVID Local Risk Index
The gradient map represents the values of these metrics laid under the school zone or district boundaries and, on the maps showing school zones, the Arkansas Department of Education-assigned letter grades for schools.
These maps serve as a resource to allow stakeholders to look at data sets for specific school districts as they work to address issues facing those districts.
Definitions of Four Measures:
• Frequent mental distress: Adults 18 or older who reported experiencing poor mental health for 14 days or more in the past month (source: 500 Cities Project Data, Centers for Disease Control and Prevention, 2016, one-year modeled estimate).
• Frequent physical distress: Adults 18 or older who reported experiencing poor physical health for 14 days or more in the past month (source: 500 Cities Project Data, Centers for Disease Control and Prevention, 2016, one-year modeled estimate).
• Children in poverty: Children younger than 18 living in households at or below 100% of the federal poverty level (source: 2017 American Community Survey, five-year estimate).
• COVID Local Risk Index: Incorporates risk factors including age, race, housing, income, and underlying health conditions to help identify cities and neighborhoods at risk for higher numbers of COVID-19 cases and more severe outcomes. The index is designed to be comparable across cities and highlight areas of risk for COIVD-19 impact (City Health Dashboard, incorporating data from the American Community Survey and the Centers for Disease Control and Prevention’s 500 Cities Project and Social Vulnerability Index).


